Why is it Critical for Data Professionals to Use AI

In this blog post, we will explore 1) the challenges encountered by data analysts, 2) three ways AI alleviates these issues, and 3) three unique advantages offered by Infoworks AI. 

The Challenges Encountered by Data Analysts

Image: NicoElNino/Adobe Stock

Challenges with complexity of tasks

Data Analysts play a crucial role in organizations by handling various responsibilities. One of their primary tasks is data collection and analysis. This involves gathering business data from various sources, cleaning and transforming it, and performing detailed analysis. Another critical role is trend measurement, where analysts analyze data to measure and understand long-term trends. Additionally, they provide customer and profit insights, helping businesses gain a deeper understanding of customer behavior and profitability. Problem identification and solving is also a key responsibility, as analysts identify business problems through data and provide actionable solutions. Finally, Data Analysts present their findings to stakeholders in a simple, visual, and easily understandable manner, ensuring that the insights are accessible and actionable.

To be successful, Data Analysts possess a diverse skill set. Quantitative skills are essential, including strong mathematical and statistical abilities, such as budgeting and probability. Qualitative skills enable them to think creatively, to interpret information, draw conclusions, and think critically. They also possess a strong business understanding to design better business models. Technical skills are also a vital part of a Data Analyst’s toolkit. Proficiency in databases, software tools, and scripting languages is necessary, along with the ability to present data insights effectively.

Challenges with time consumption

Despite their expertise, Data Analysts face significant challenges meeting the demands of the business and can spend 80% of their time assembling the data needed for analysis. Cleaning and transforming data can be time-consuming. Query writing is another area where analysts encounter difficulties; writing complex SQL queries requires expertise and can be prone to errors. Visualization is an additional pain point, as creating charts and visual reports takes extra time. Many tasks in a Data Analyst’s role are repetitive and could benefit from automation, highlighting the need for tools and technologies that can streamline these processes and enhance efficiency.

3 Ways AI Makes a Data Analyst’s Job Easier

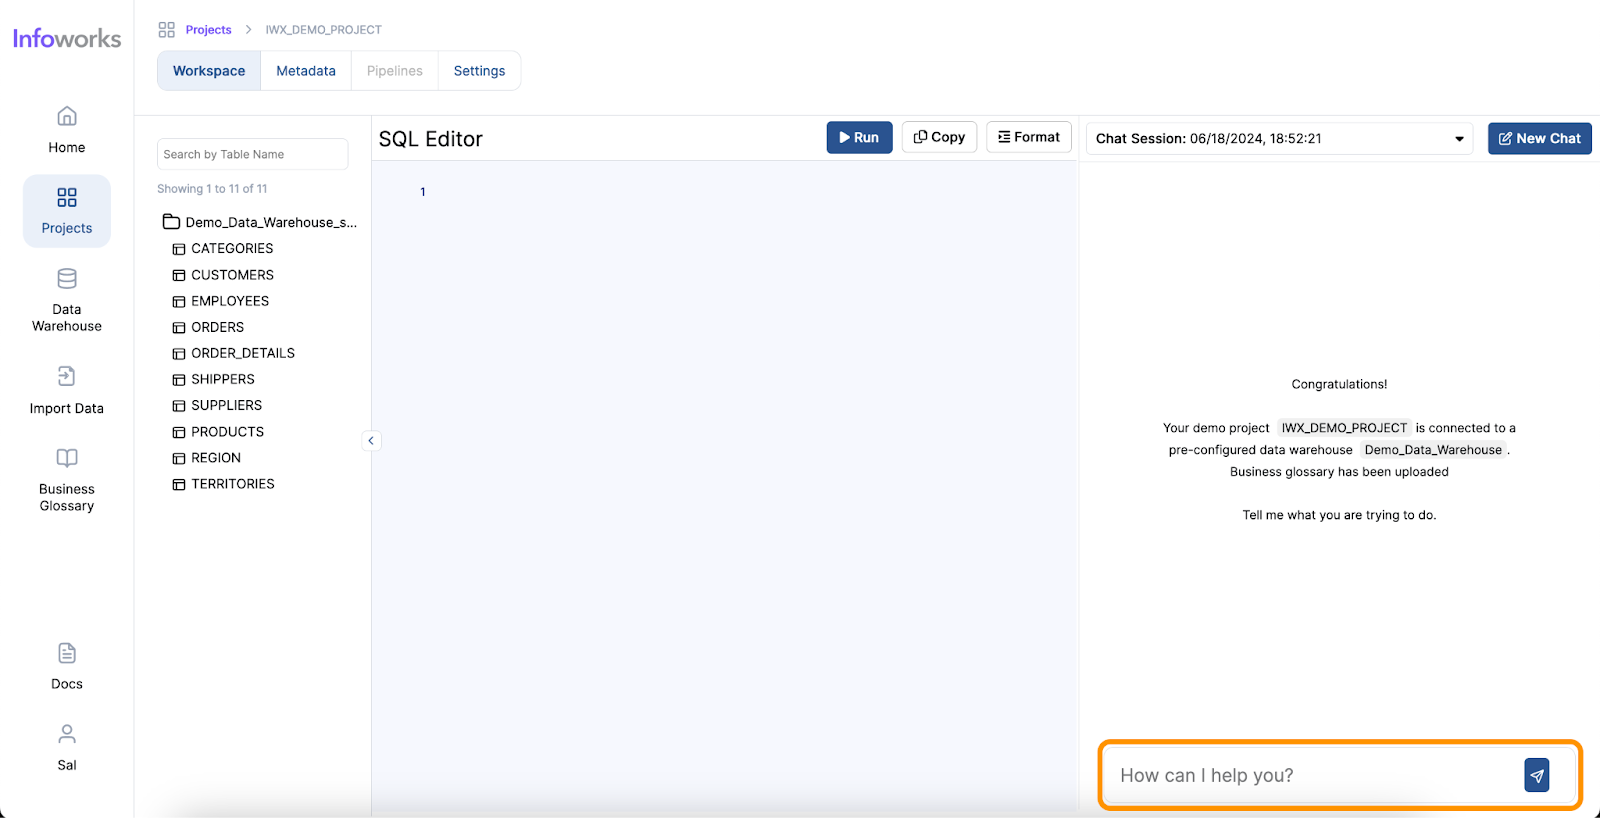
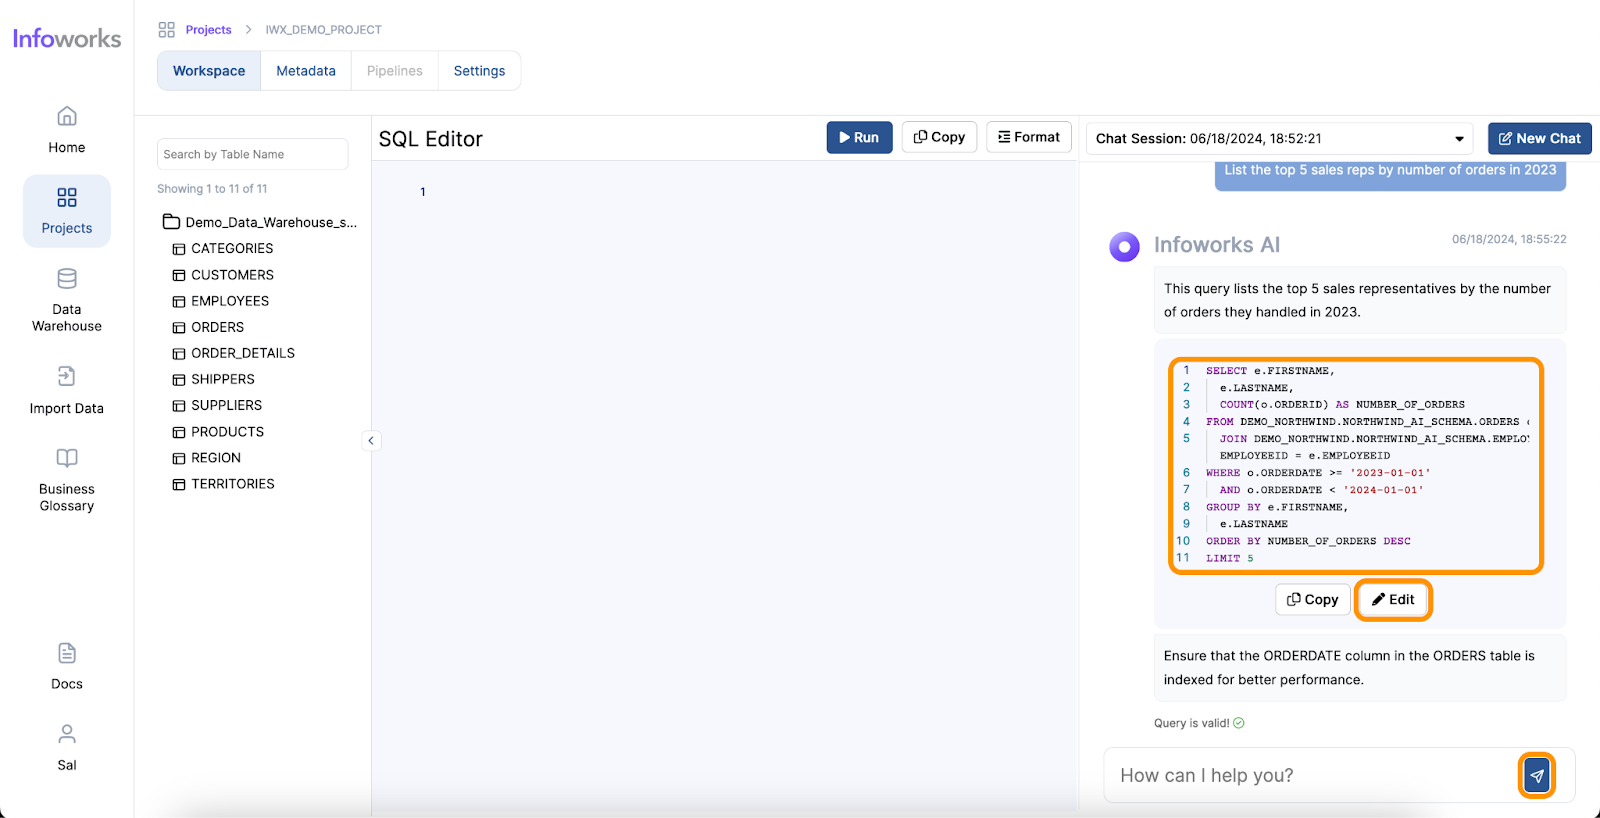
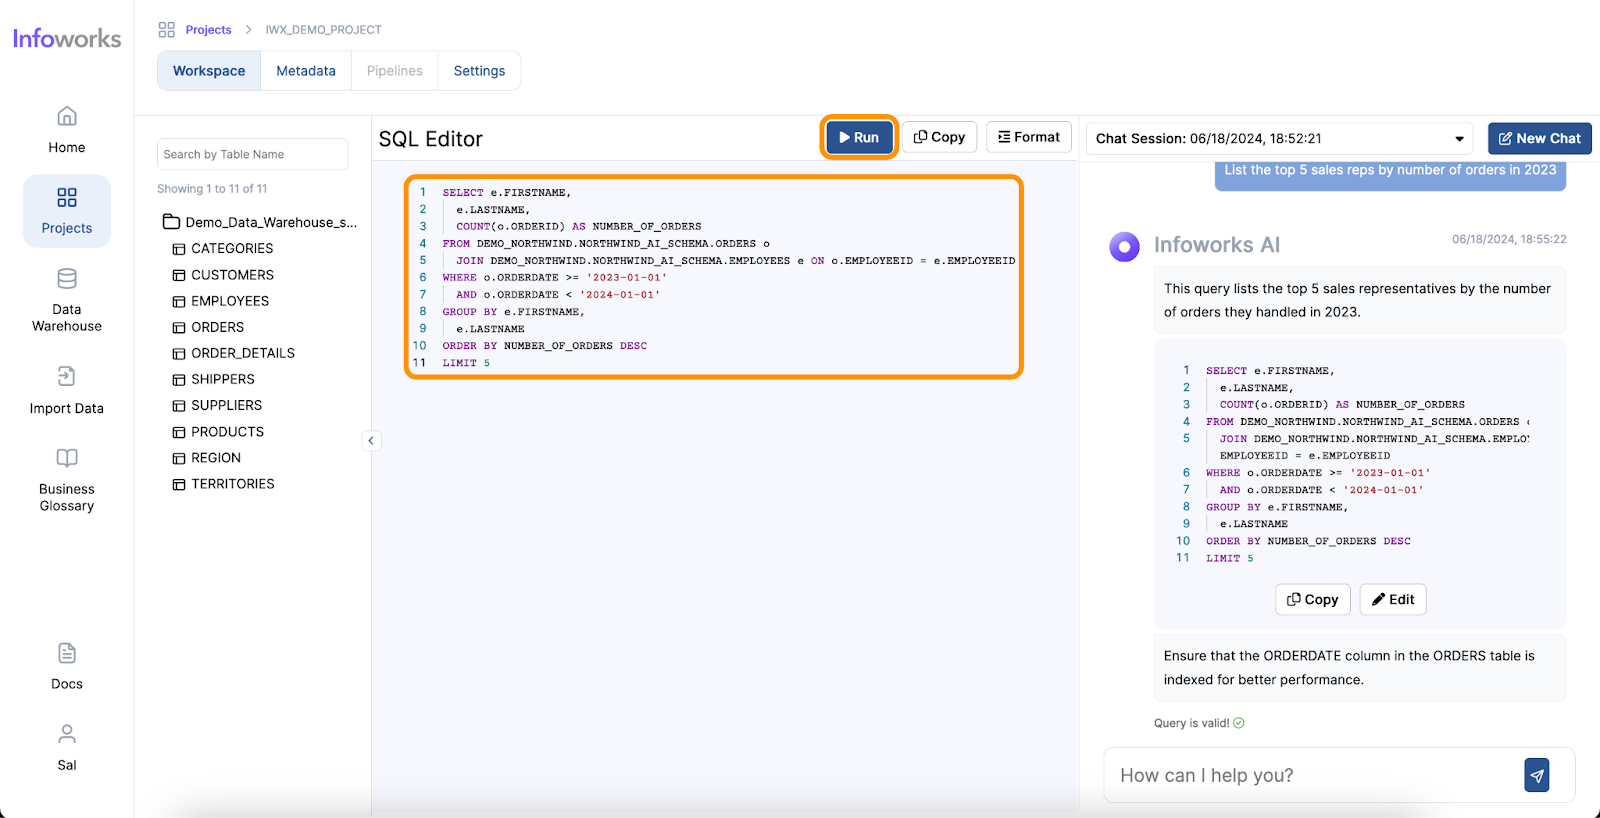
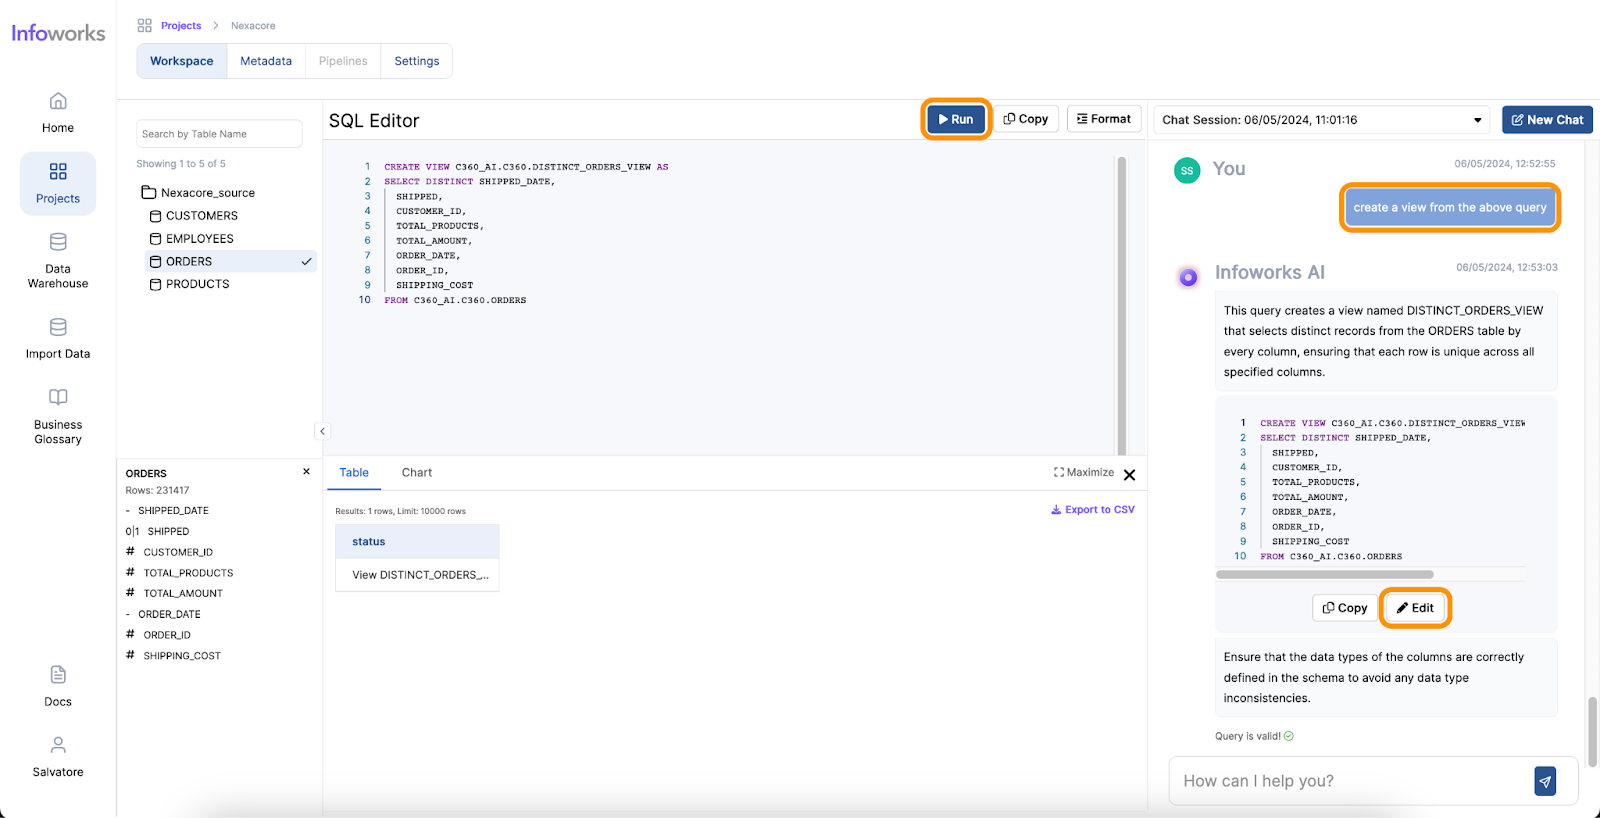
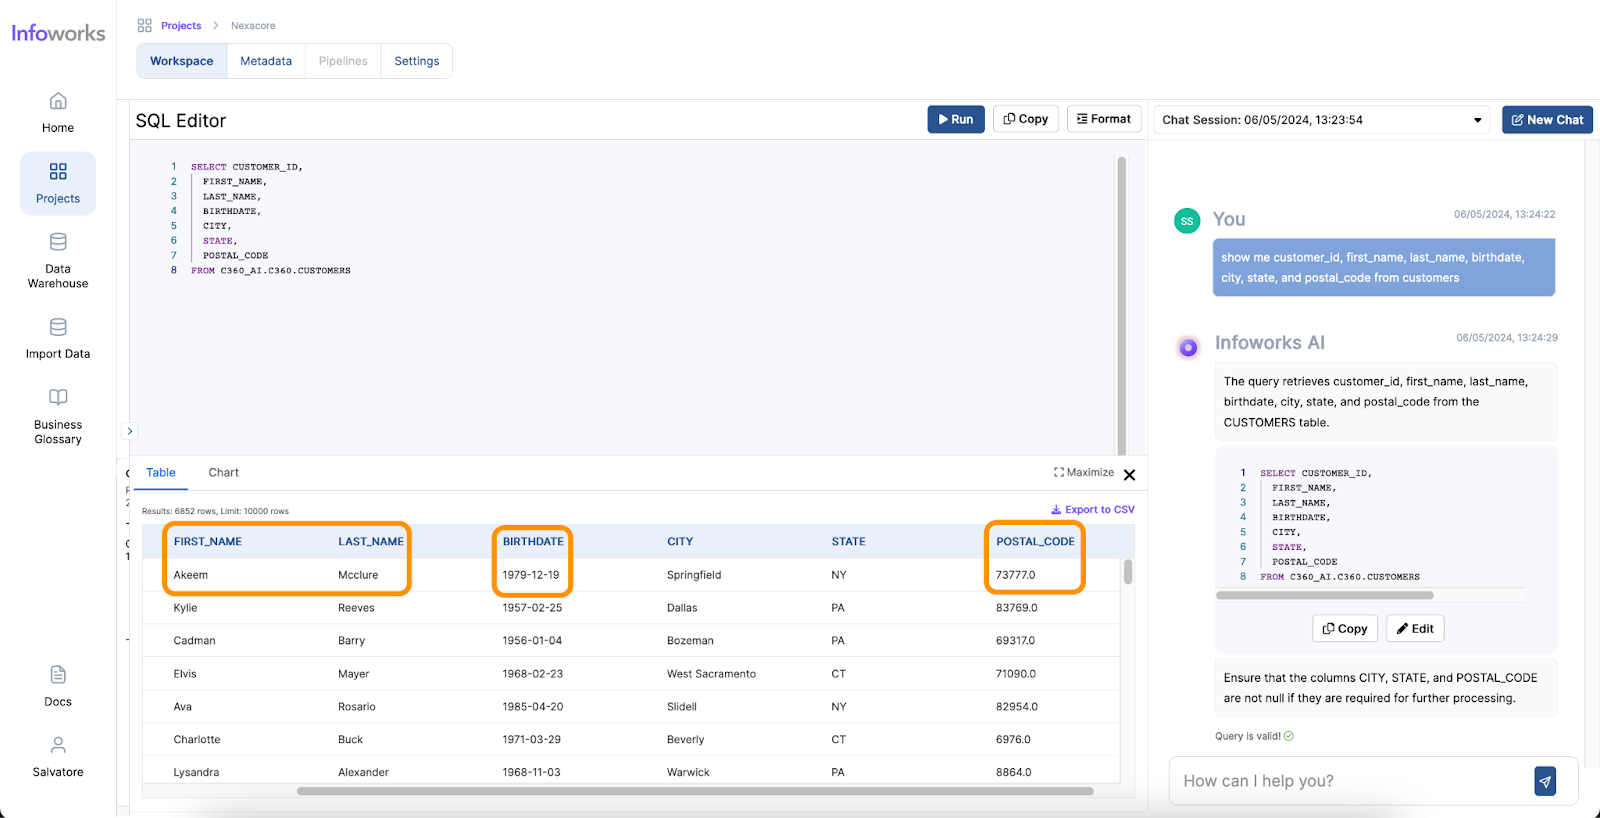
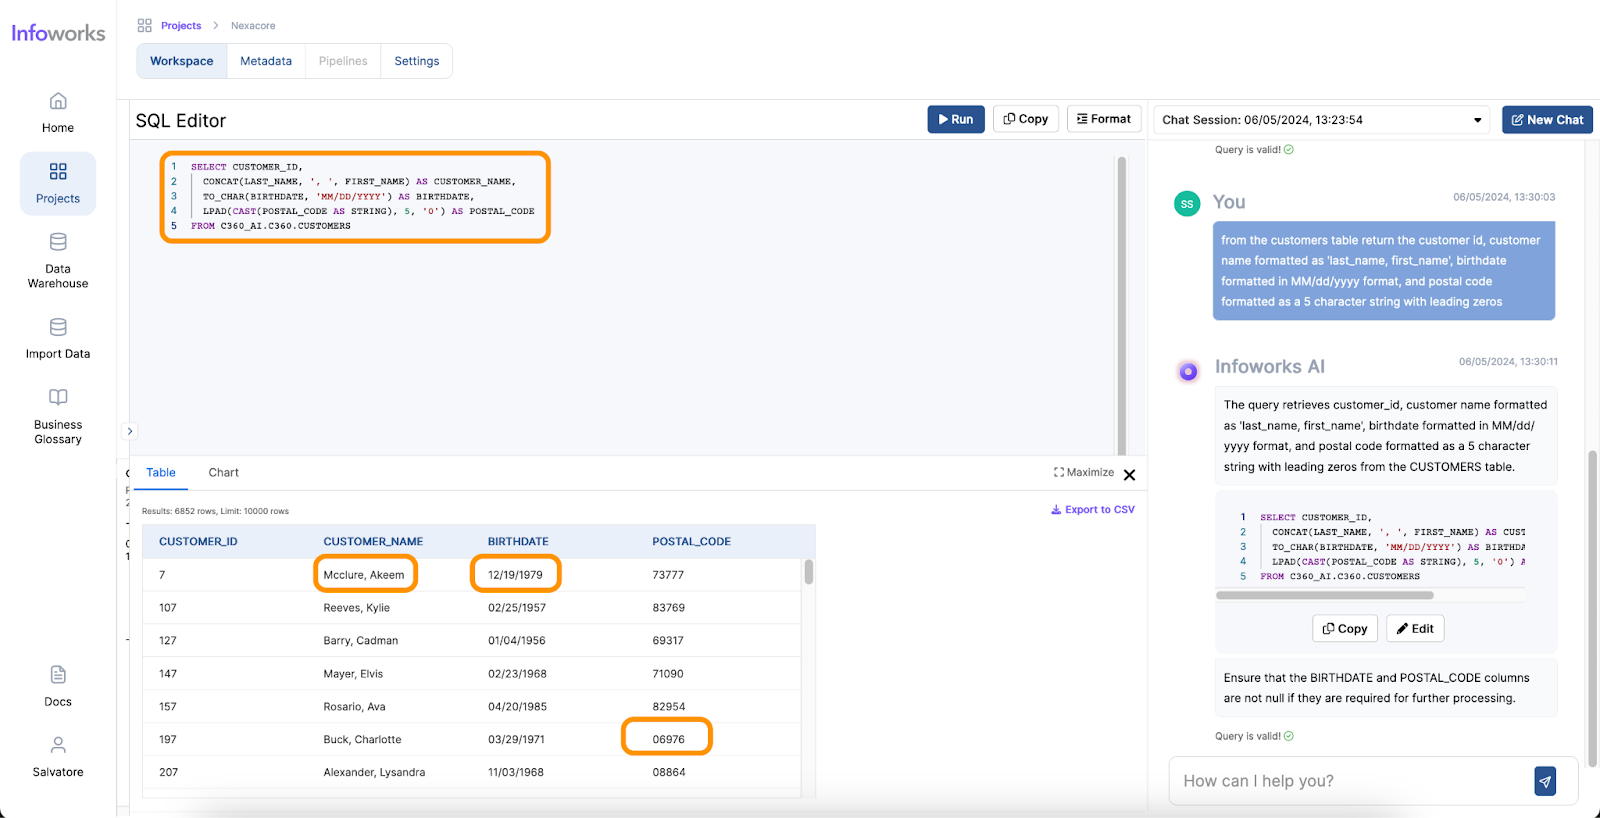
AI-powered text-to-SQL tools simplify and accelerate the work of Data Analysts by providing an intuitive way to generate SQL queries from natural language inputs. Here’s how they address the common pain points:

Time Saved

One of the most significant benefits of AI for Data Analysts is the time saved in performing complex tasks. Traditionally, generating queries and visualizations can take hours or even days, depending on the complexity of the data and the analysis required. However, with AI, these tasks can be completed in minutes. AI tools streamline the process, allowing analysts to focus on interpreting the results and making data-driven decisions more quickly.

Ease of Use

The user-friendly nature of AI tools significantly enhances the ease of use for Data Analysts. These tools often come with intuitive interfaces where analysts can input queries in natural language, reducing the need for extensive training. The minimal learning curve means that even those with limited technical expertise can quickly start using AI tools to generate insights. AI tools also enhance analysts’ skill sets by offering quantitative assistance, such as predictive analytics and pattern recognition, as well as qualitative assistance, like natural language processing and sentiment analysis. Furthermore, AI provides technical assistance by automating query generation, data visualization, data cleansing, and task automation.

Cost-Effectiveness

AI also offers a cost-effective solution for data analysis. Traditional methods often require significant investment in multiple tools and training resources to equip analysts with the necessary skills and software. In contrast, AI platforms provide multiple functionalities within a single, integrated solution. This not only reduces the overall cost but also optimizes the use of resources, making it easier for organizations to manage their data analysis processes efficiently.

3 Key Differentiating factors of Infoworks AI:

Superior Accuracy in Text-to-SQL

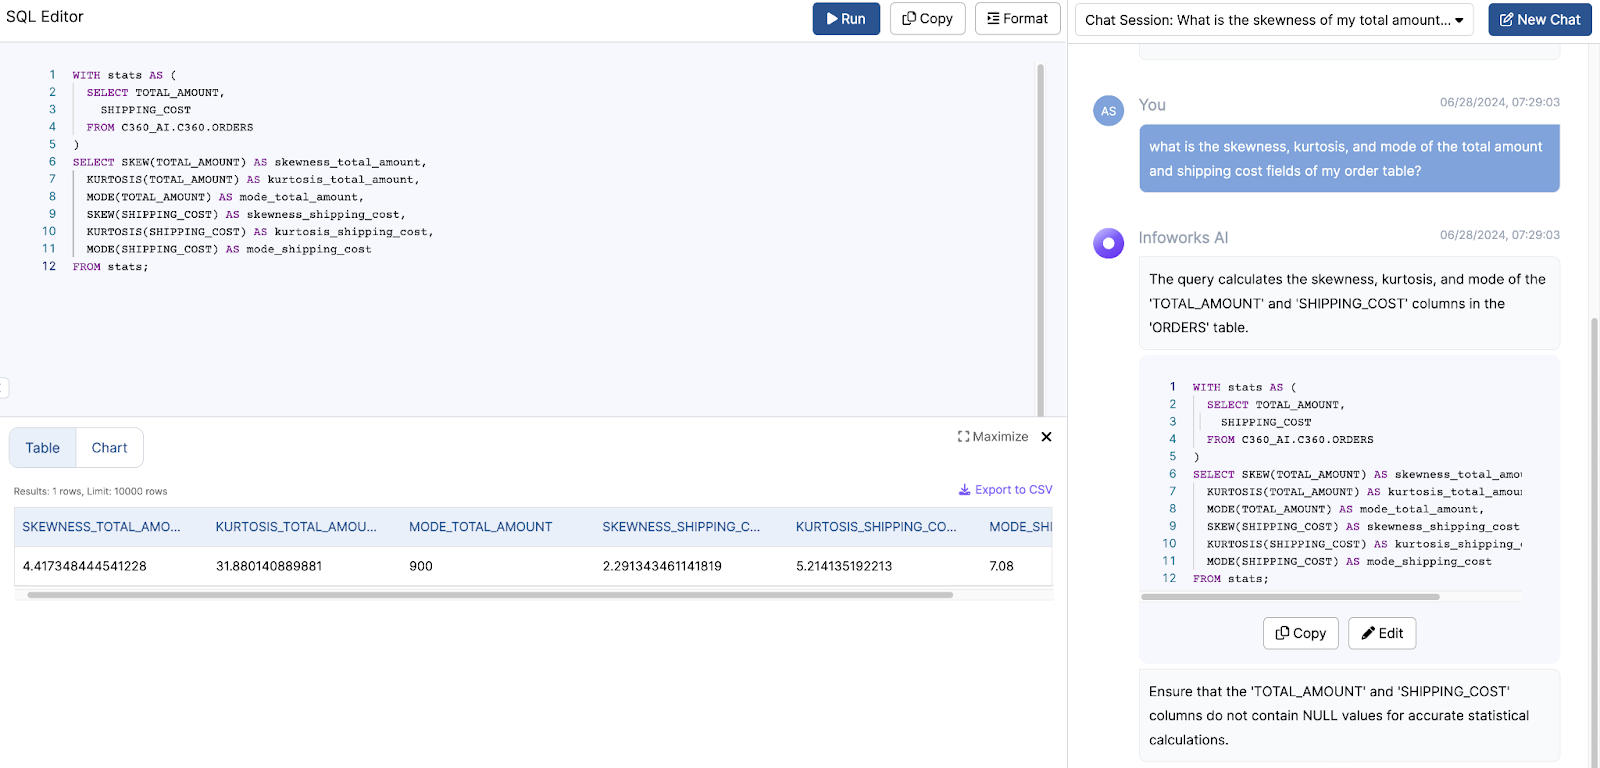
One of the standout features of Infoworks AI is its superior accuracy in text-to-SQL conversions. While traditional text-to-SQL tools typically achieve an accuracy rate of around 60-65%, Infoworks AI leverages continuous improvements and advanced AI algorithms to reach accuracy levels of 75-85%. It overcomes the common challenges of text-to-SQL generation through advanced prompting techniques, utilizing insights from extensive benchmarking on diverse datasets. Additionally, Infoworks AI incorporates sophisticated AI methods to maximize contextual accuracy, allowing it to better understand the user’s intent and context. This results in more accurate and relevant query generation, streamlining the data analysis process. This significant enhancement in accuracy ensures that data analysts can rely on the tool for precise query generation, reducing the likelihood of errors and increasing overall efficiency.

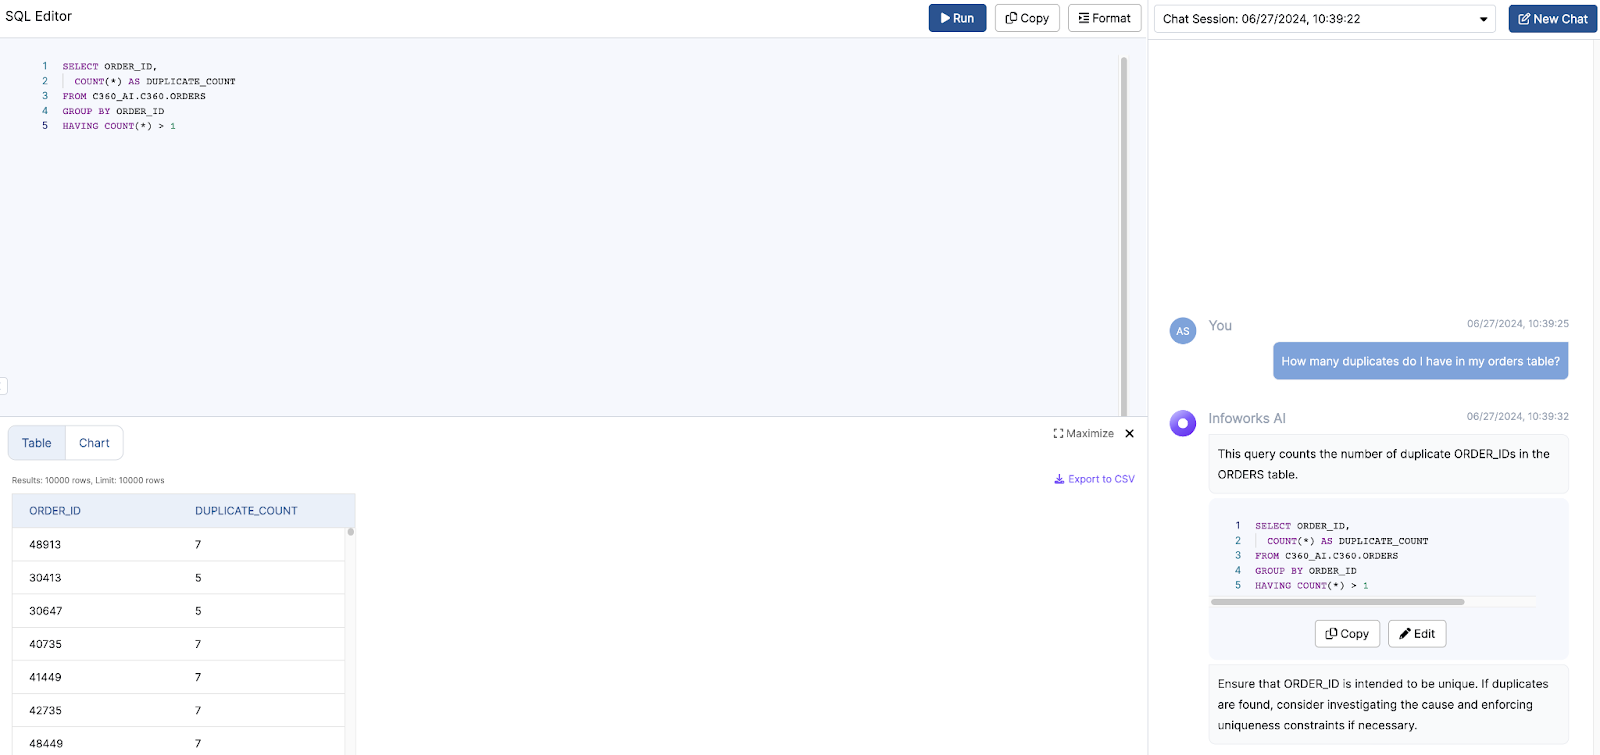
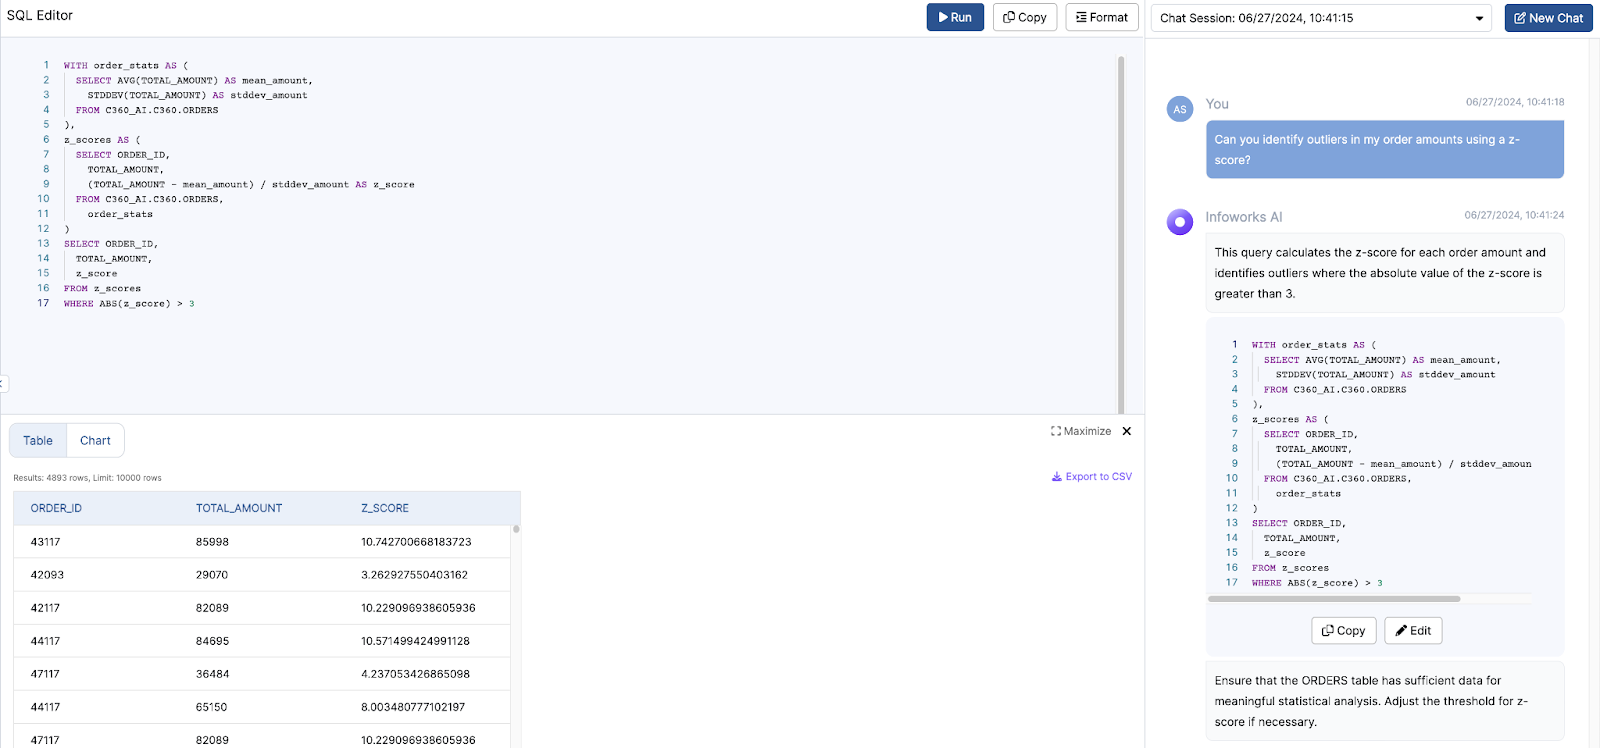
Comprehensive Supported Operations and Functionalities

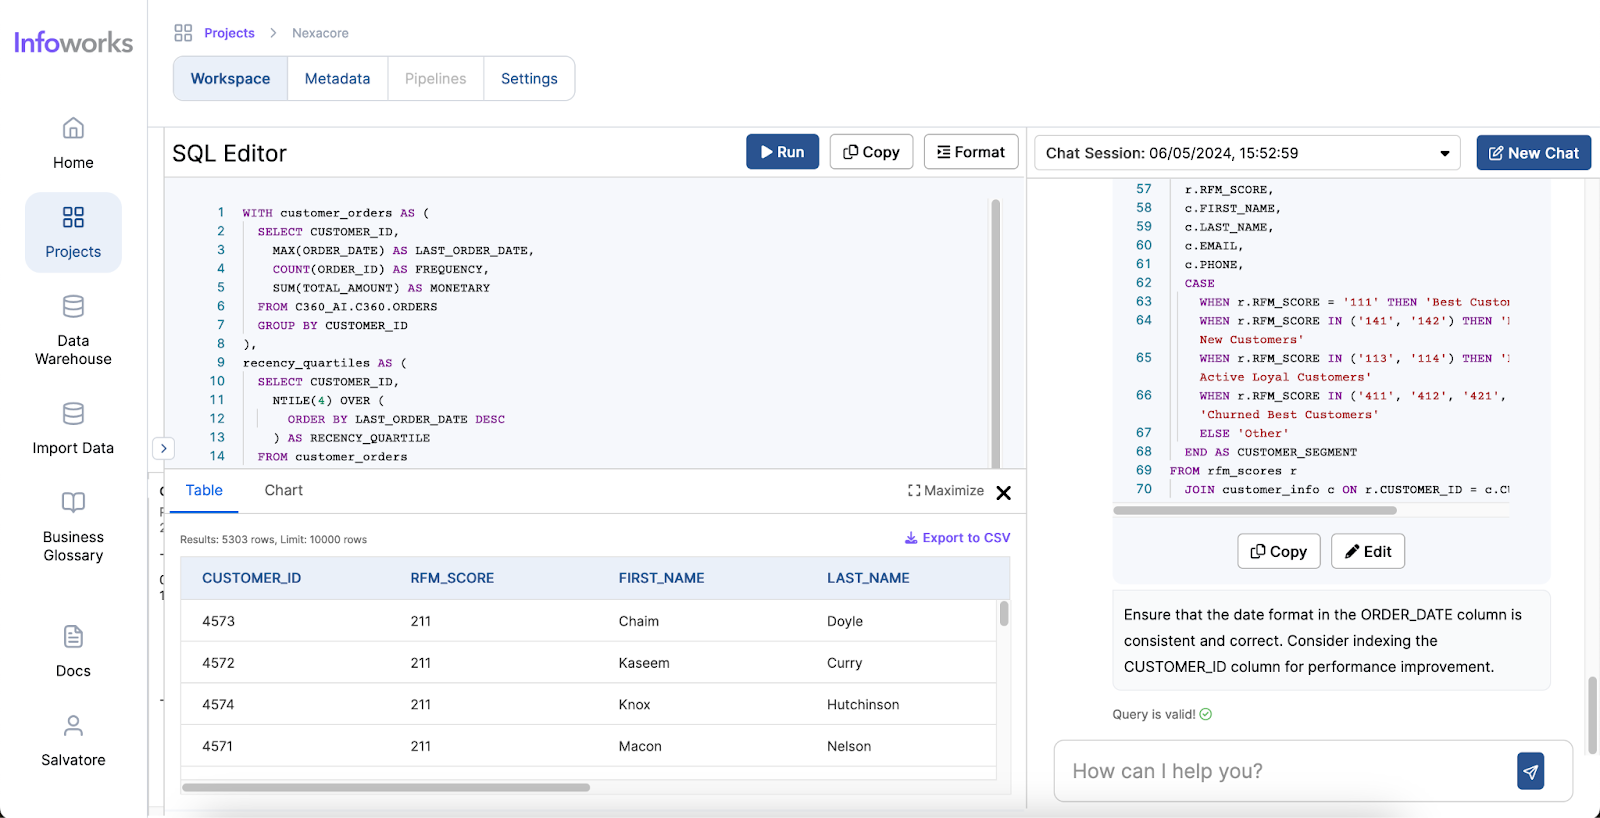
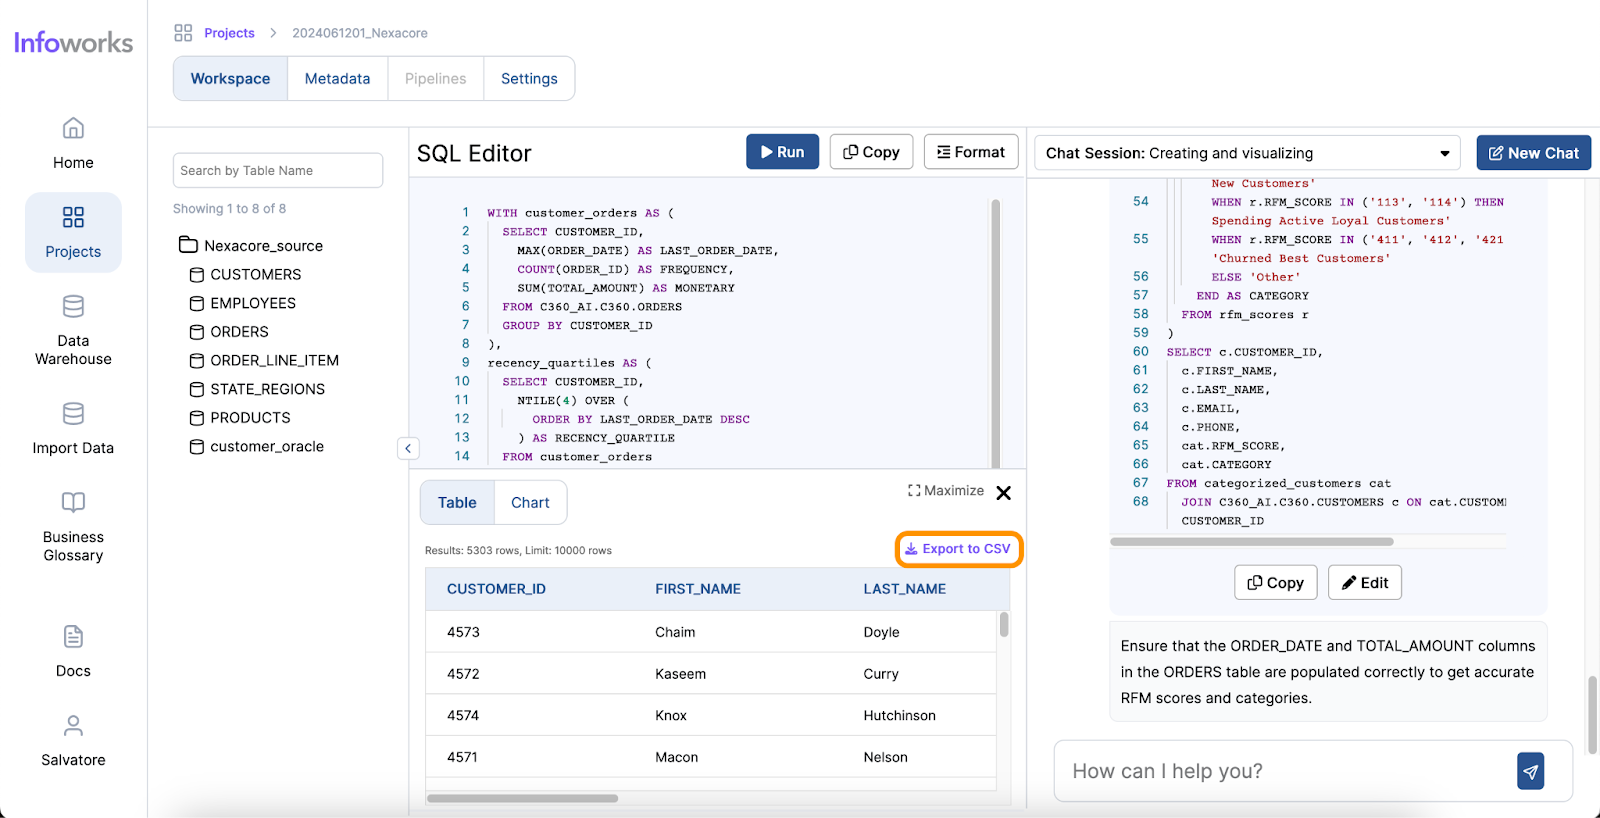
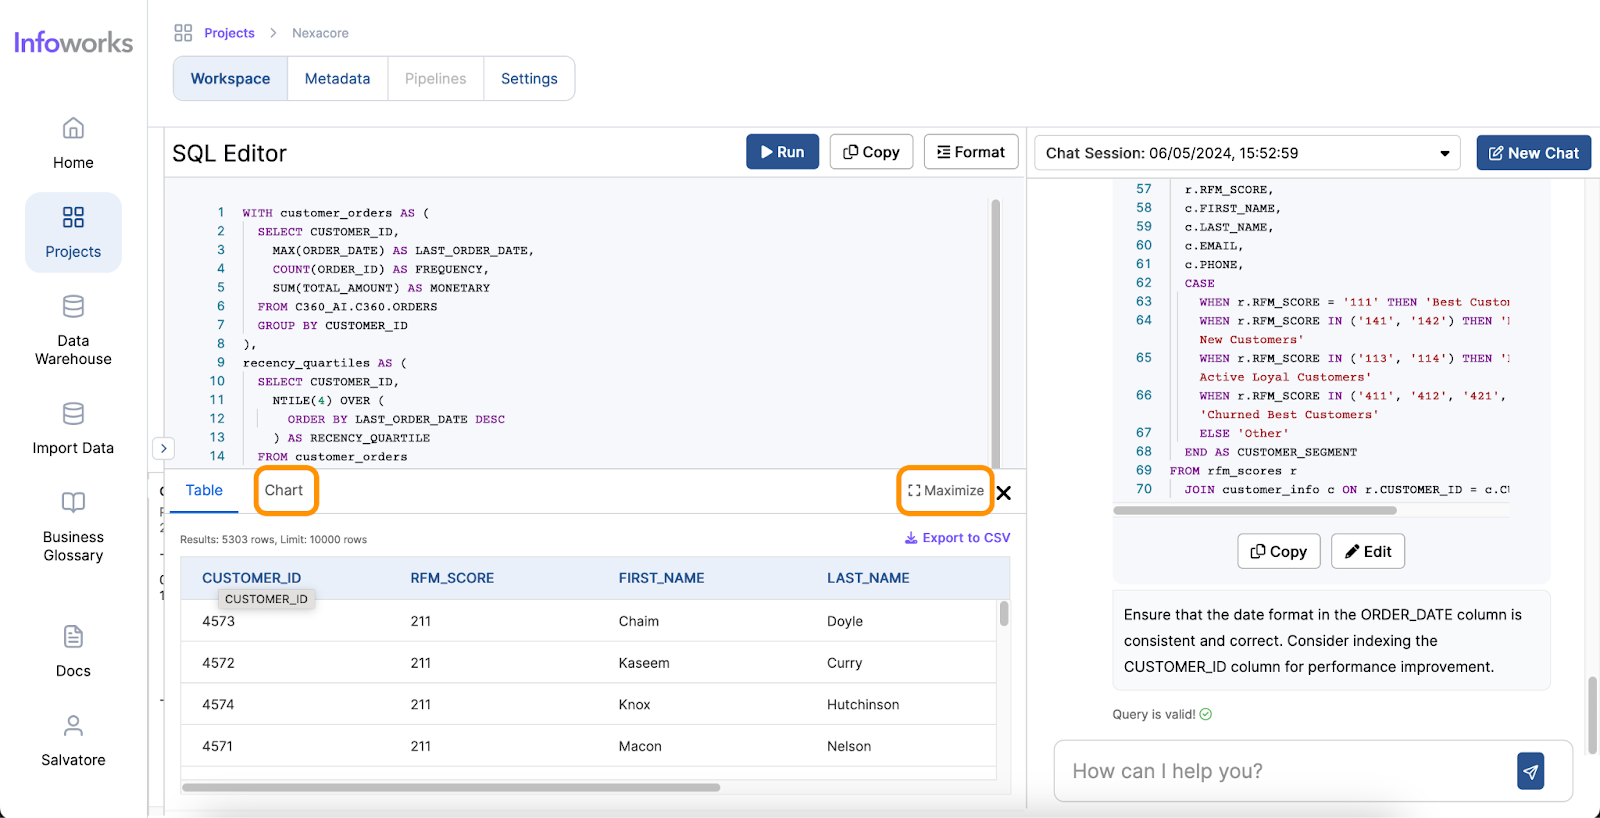
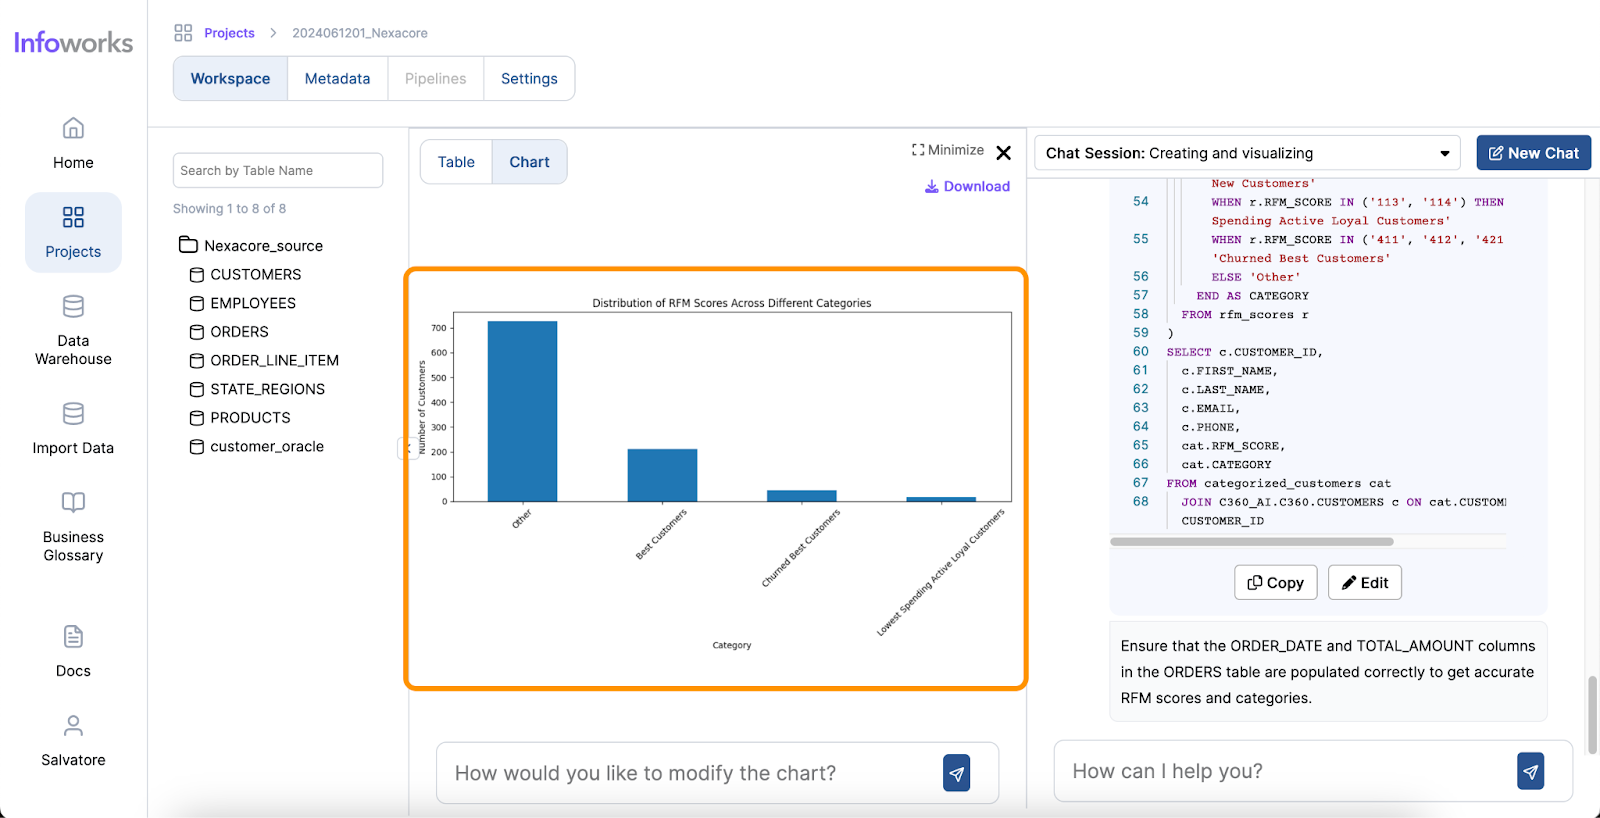
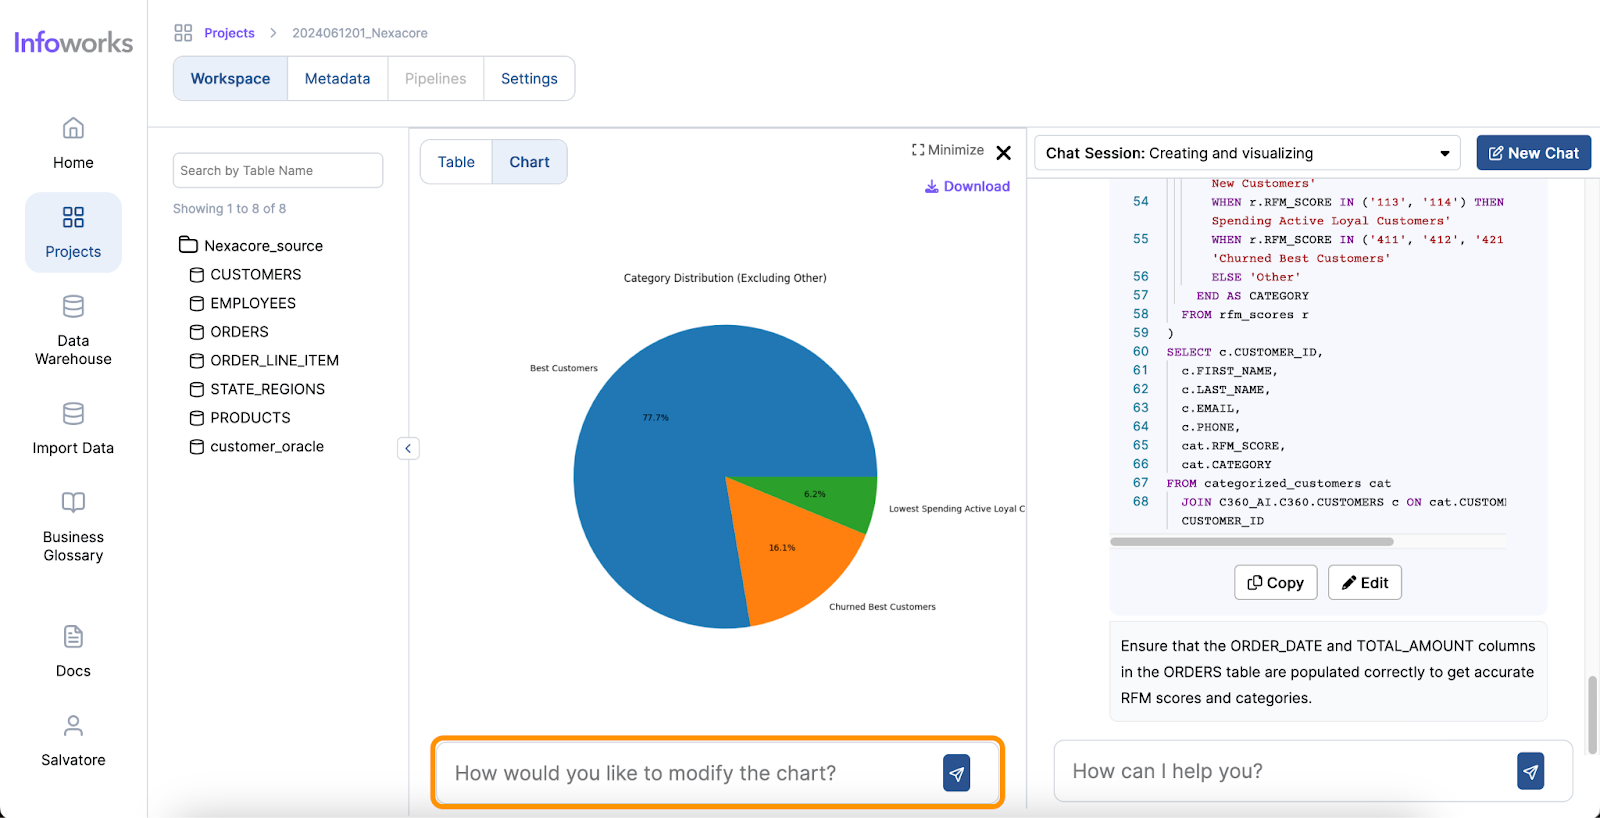
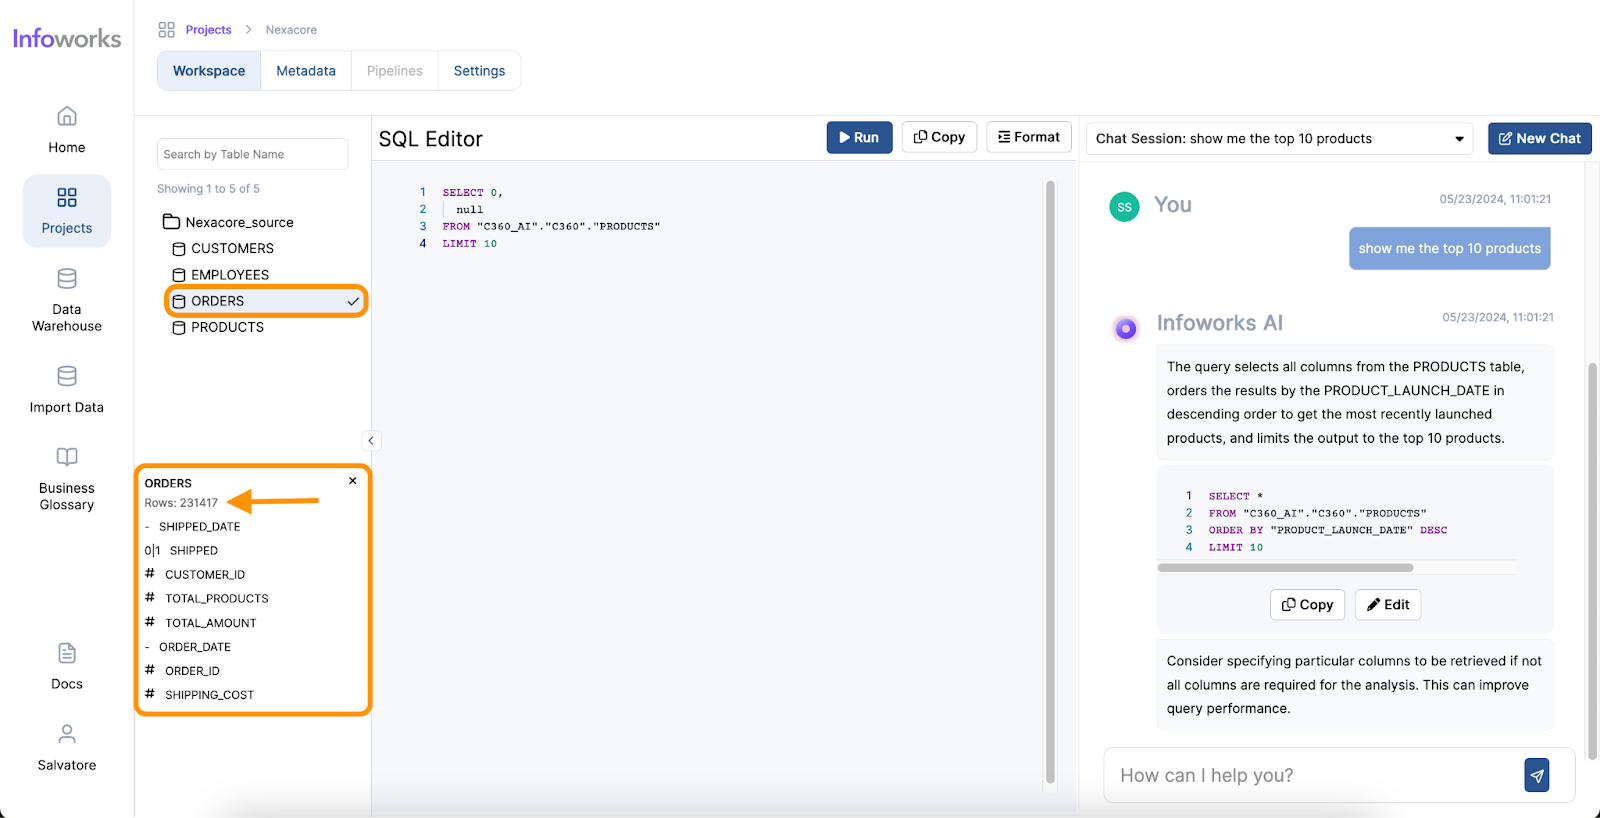
Infoworks excels in its wide range of supported operations and functionalities, making it a versatile tool for data analysts. The platform also offers automation for data discovery, data profiling and data cleansing, significantly simplifying these processes. Moreover, Infoworks AI enables the generation of SQL queries from natural language inputs and effortlessly creates charts and visual reports. These capabilities not only save time but also enhance the overall data analysis experience, making Infoworks AI a powerful and efficient tool for modern data professionals.

Cost-Effectiveness of Using Infoworks AI

Infoworks AI is designed to be a cost-effective solution for data analysis, providing significant savings compared to traditional methods. By integrating features such as data migration, cleansing, transformation, query generation, and visualization into a single platform, Infoworks AI optimizes resource utilization and reduces overall costs. Moreover, the increased accuracy and efficiency provided by Infoworks AI translate into better business outcomes, as data analysts can generate insights faster and with higher precision. This improvement in productivity and decision-making capabilities ultimately leads to cost savings and a higher return on investment, making Infoworks AI a smart, cost-effective choice for organizations looking to enhance their data analysis processes.

Conclusion

AI-powered text-to-SQL tools are game-changers for Data Analysts, making their work more efficient, accurate, and cost-effective. By leveraging these advanced tools, Data Analysts can focus more on deriving insights and less on the technicalities of data preparation and query writing, ultimately driving better business decisions. Adopt AI now, or risk falling behind other professionals.

Exploring Your Data Using Infoworks AI

Introduction

When analyzing data, exploring your data is an essential first step because it helps uncover underlying patterns, identify data quality issues, and ensure the accuracy of your analysis. This critical step lays the foundation for making informed decisions and deriving meaningful insights from your data. 

Infoworks AI is a powerful tool that simplifies the process of data exploration and analysis, enabling data analysts to gain insights quickly and efficiently with the help of Business-Aware AI™. In this blog post, we will explore how to use Infoworks AI for three critical data exploration tasks: profiling data, detecting duplicates, and identifying anomalies.

Profiling Data

Data profiling is the process of examining the data available from a data source and collecting statistics and informative summaries about that data. Infoworks AI makes this task straightforward with its automated profiling ability and using the natural language interface to make custom profiling inquiries.

Infoworks AI has a powerful feature built in to profile your data automatically. When adding a new warehouse or editing an existing one, there is a checkbox to enable  “Automatically Profile the data”. When you select this option and click “Fetch Schema”, Infoworks AI runs profiling queries against the schema tables.

This process will provide you with always-available profiling information you can reference within a project’s Workspace. Using the 3 dots next to a table’s name, you can click Show Profile:

This will pull up the profiling results, which includes histograms and metrics such as unique values, min & max, standard deviation, and more. 

If your use case requires additional profiling statistics such as mode or skewness, the natural language interface allows you to prompt Infoworks AI for custom profiling data. Here’s an example of the results when I ask the AI to provide the skewness, kurtosis (a measure of the “tailedness” of the data distribution), and the mode of the total amount and shipping cost in my orders table: 

Profiling your data helps in understanding its structure and quality, making it easier to identify potential issues early in the analysis process. 

Detecting Duplicates

Duplicate records can skew analysis results and lead to incorrect conclusions. Infoworks AI offers several methods to detect and manage duplicates in your data.

To identify duplicates, you can use natural language prompts. For example, you might ask a prompt as simple as “How many duplicates do I have in my orders table?”, or a more detailed prompt with additional guidance for improved accuracy such as: “Show me all order data while making sure there are no duplicate combinations of order id and shipping date.” 

Infoworks AI can count duplicates based on various criteria, such as the primary key or all columns in a row, providing a clear picture of the extent of duplication in your dataset.

Once duplicates are identified, you can decide whether to flag them or create a de-duplicated view for analysis. For instance, you can say, “Using the previous criteria, show order data with duplicates marked with an indicator,” or “Create a view to show de-duplicated order data based on unique rows of data.” These capabilities ensure that your data analysis is based on accurate and unique records.  

Identifying Anomalies

Anomaly detection is crucial for identifying unusual patterns that might indicate errors, fraud, or other significant issues. Infoworks AI supports several methods for detecting anomalies, including standard deviations, percentiles, interquartile range (IQR), and median absolute deviation (MAD).

For example, to identify outliers using the z-score method, you can prompt, “Can you identify outliers in my order amounts using a z-score?” Similarly, using percentiles, you might ask, “Can you identify outliers in my order amounts that fall outside of the 1st and 99th percentile?” 

These methods allow you to spot data points that deviate significantly from the norm, enabling more focused investigations and data quality improvements.   

Conclusion

Infoworks AI streamlines the process of data exploration with built in features and through its Business-Aware AI™, making it accessible even for users with limited technical expertise. By leveraging Infoworks AI data exploration abilities for profiling data, detecting duplicates, and identifying anomalies, data analysts can ensure high data quality and derive meaningful insights more efficiently.

Whether you are starting a new data project or maintaining an existing dataset, Infoworks AI provides the tools necessary to explore, cleanse, and analyze your data effectively. Stay tuned for more detailed guides on using Infoworks AI to address specific data challenges.

Infoworks AI Quickstart Guide

Version 2.0

Welcome

This guide contains two sections to help you get started using Infoworks AI. First, explore the demo project in the Exploring the Demo Project section below. Second, go to the Connecting To Your Cloud Data Warehouse section to use Infoworks AI with your data.

Exploring the Demo Project

A demo project has been provided in order to get started quickly.  The demo project contains sample data and a sample business glossary (more on the business glossary later).

Click on Demo Project

  1. Click on the ‘Click here to access a demo project.’ button from the home screen.
  1. This should take you to the main project screen for the demo project.  This screen allows you to enter natural language requests to generate SQL queries.

Generating SQL

  1. Enter a request in natural language.  Some examples for the sample project are included below.
    1. List the top 5 sales reps by number of orders in 2023
    2. Show product category sales by customer territory
    3. How many orders were there by month in 2022?
  1. Submit your request.  This will return a SQL query aligned with the request that was submitted.  Take a minute to review the SQL.
  2. Once the SQL is returned, select the ‘Edit’ button to bring the SQL into the editor pane.
  1. Modify or run the SQL and review the results.
  1. Congratulations!  You have successfully completed your first query using Infoworks AI.

Connecting To Your Cloud Data Warehouse

If you’d like to explore your own data warehouse, follow the instructions below to set up your own project.

Create a Data Warehouse Connection

Creating your own data warehouse connection allows you to connect to your own Snowflake data warehouse and generate SQL queries against it using natural language requests.

  1. If not already on the ‘Data Warehouse Connections’ page, select ‘Data Warehouse Connections’ on the left hand navigation.
  1. Select the ‘Add Connection’ button in the top right corner of the screen.
  1. In order to connect to your data warehouse, ensure that inbound traffic is permitted from the below IP addresses.
    1. 35.224.77.139
    2. 130.211.232.123

Reach out to your Snowflake team for assistance.  More information can be found here: https://docs.snowflake.com/en/user-guide/network-policies

  1. Enter the data warehouse connection information on the next screen and select ‘Test Connection’.
  2. After testing the connection, select ‘Fetch Schema’ to gather the table and column definitions from the data warehouse connection.
  3. Next select ‘Profile Data’ to gather additional information about the data such as sample values.
  1. Select ‘Back’ to close the connection configuration screen
  1. Congratulations!  You have successfully completed setting up a data warehouse connection.

Creating a Knowledge Base (optional)

An optional knowledge base can be added to provide additional business context to the data warehouse technical metadata. This allows for providing business definitions to your already existing data warehouse.

  1. Select ‘Business Glossary’ from the left hand navigation.  The business glossary associates business descriptions and definitions with the technical schema of the data warehouse.
  1. Select the ‘Add Business Glossary’ button.
  1. Download the sample business glossary and save it as a .csv file to your local machine.  Modify the business glossary to align with your data warehouse.
  1. Select your warehouse connection and select the ‘Choose A File’ button.
  1. Navigate to the .csv file created in step #3 and select ‘Open’.
  2. Add additional business glossary .csv files as needed.
  3. Select ‘Save Changes’ when all business glossary files have been added.
  1. Congratulations!  You have successfully added a business glossary.

Create a Project

A project organizes your data warehouse and business glossary into a module where all your work can be saved.

  1. Navigate to the ‘Projects’ section in the left hand navigation.
  1. Select the ‘Create New Project’ button.
  1. Provide a name and description for the project and select a data warehouse to associate with the project.  Click ‘Save’.
  1. Congratulations!  You have successfully created a project.

Generating SQL

Now you’re ready to start making requests of your own data warehouse.

  1. Navigate to the ‘Projects’ section on the left hand navigation and select your newly created project.
  1. Refer back to the ‘Generating SQL’ section to get started with your own project.

Customer Segmentation Use Case Part 4: Data Analysis and Reporting

Introduction

In this blog post we will apply our Recency, Frequency, and Monetary (RFM) customer segmentation model to our data and visualize the results.

In part 1, we described the Customer Segmentation use case, introduced the RFM segmentation framework, and articulated how we can use that segmentation method to provide value for our fictional organization, Nexacore.  Click here to review that blog post.

In part 2, we described how to get started with Infoworks AI by connecting to Nexacore’s data, creating a knowledge base, and creating a project.  Click here to review that blog post.

In part 3, we began to explore our Nexacore data set through profiling and exploring the metadata.  We also saw how we are able to use Infoworks AI to cleanse our data by deduplicating and formatting values to meet our use case.  Click here to review that blog post.

Data Analysis

RFM Model Review

We discussed the RFM model in Part 1 of this blog series, but as a refresher, RFM is a customer segmentation tool that scores customers based on how recently a customer made a purchase, how frequently they purchase, and how much money they have spent with the organization.  Based on these three measures, customers are divided into quartiles and a composite score is generated.

Applying the RFM Model

We’re going to apply the RFM model to our Nexacore data set.  At this point we’ve already looked at the metadata of the orders table and determined that it contains all of the information we need to calculate an RFM score.  The order_date column will allow us to calculate recency, the order_id column will allow us to calculate the frequency, and the total_amount column will allow us to calculate the monetary score.

All we need to do is ask Infoworks AI to calculate the RFM score for us, by submitting the prompt below in the ‘Start conversation here…’ box.

‘do a recency, frequency, and monetary analysis of our customers; segment the customers using quartile for each metric with the first quartile representing the most recent, most frequent, and most monetary; concatenate the 3 values into a single RFM score’

The AI model is able to determine how to 1) calculate the RFM score, 2) generate a SQL query to carry out the task, and 3) validate the syntax of the query issued.  Let’s run that query to see the result by selecting the ‘Edit’ button below the query and selecting the ‘Run’ button in the SQL editor pane.

Notice the results contain the customer_id and the corresponding RFM score.  Based on the RFM score, we can categorize customers.  These categories are defined in our business glossary (see Part 2 of this series for more information on the business glossary).  These categories are below.  More categories can be added if desired.

CategoryRFM ScoreNotes
Best Customers111The customers who purchased recently, frequently, and have higher monetary spending.
High Spending New Customers141, 142The customers who have purchased recently, but infrequently, and have higher monetary spending.
Lowest Spending Active Loyal Customers113, 114The customers who have purchased recently and frequently, but have lower monetary spending.
Churned Best Customers411,412, 421, 422The customers who have not purchased recently, but have purchased frequently and have higher monetary spending.

Since this data is in our business glossary, we simply need to submit another prompt like the one below.  We can also add customer name and contact information to our result set at the same time.

‘categorize customers based on RFM score and add customer name and contact information’

Submitting this prompt provides us a query that contains all of the information we need.  As a last step, we’ll visualize the data before passing it back to our marketing team.

Reporting

In this last step, we’re going to report on and visualize the results and pass them onto the Nexacore Marketing team.

First, let’s see how we can export our results.  Infoworks AI allows us to export the results as .csv so that they can be further analyzed in other tools.  Simply click the ‘Export to CSV’ link to export and download the result set locally.

Infoworks AI also provides visualization capabilities on top of the data.  We’re simply going to select the ‘Chart’ tab in our previous example and maximize the frame.

As we can see, Infoworks AI selected a default visualization.  

I’d like to display a chart showing the number of customers by category in a pie chart, but I want to remove the other category.  I can simply ask Infoworks AI to “Modify the results to filter out the ‘Other’ category and display as a pie chart.’’ text box.

The results show that we do have a significant number of churned customers.  We can pass this on to our marketing team as a next step.

Summary

This concludes the series on using Infoworks AI to analyze data using natural language, artificial intelligence, and business glossary information.

In prior posts we learned about the use case, set up our environment, and explored the data.  In this blog post we saw how we can use Infoworks AI to apply a customer segmentation model to our data.  Using the general knowledge of the AI model on the RFM methodology, coupled with the technical metadata of the data warehouse, we were able to generate a SQL statement to calculate an RFM score for each customer.  Then, utilizing the business glossary in the knowledge base, we were able to apply a categorization of the generated scores.  Finally, we visualized the data, validating the churn issue for the Nexacore marketing department.

This blog series demonstrates the value Infoworks AI provides in streamlining the creation and organization of new data sets.  You can apply this analysis to your data or create different analytics leveraging the process demonstrated here. 

Customer Segmentation Use Case Part 3: Data Exploration and Cleansing with Infoworks AI

Introduction

In this blog post, we’ll continue to address our Customer Segmentation use case by starting to work with our data.  

In part 1, we described the Customer Segmentation use case, introduced the RFM segmentation framework, and articulated how we can use that segmentation method to provide value for our fictional organization, Nexacore.  Click here to review that blog post.

In part 2, we described how to get started with Infoworks AI by connecting to data, creating a knowledge base, and creating a project.  Click here to review that blog post.

In part 3, we will understand, discover, and prepare our data.  First, we’ll get a general overview of the data through exploring the metadata and profiling the data.  Next, we’ll do some data cleansing by deduplicating and formatting our data.

Data Exploration

To begin, we need to understand the data that is in our data warehouse.  First, select your project from the home screen.  If you do not yet have a project, see part 2 of our blog series (link above).  I’m going to use my Nexacore project.

Metadata

On the project screen, we can start to explore our data using the list of tables to the left.  Since we’re doing an analysis on order recency, frequency, and monetary value, I’ll select the orders table to look at the table schema.

Here I can see that my orders table has about 231 thousand rows.  I can also see that the table contains an order date column to help me calculate order recency, a customer ID column to help with order frequency, and a total_amount column to assist in calculating my monetary metric.

Data Profiling

Now that I have a better understanding of my orders table, let’s get a better understanding of the data it contains.  To do that we’re going to use the Infoworks AI chat feature to profile our data.

First I’m going to click the ‘Start conversation here…’ text input on the bottom of the chat screen.

I’m going to ask Infoworks AI to profile the data in my orders table by entering ‘Profile my orders data.’ in the text input and pressing ‘Enter’.

After a moment, the AI model will return a query.  In addition to the SQL query, it will also return an explanation of the SQL query as well as additional hints in executing the query.

Note that because we gathered the table metadata as part of the data connection process (see Part 2), Infoworks generates the appropriate profiling query based on the data types of the columns in the table.

Next, I’m going to run the query by pressing the ‘Edit’ button to bring the SQL into the editor.  In the editor, I can run the SQL by pressing the ‘Run’.  

When I run my query, I get a profile of my data.  The data profile provides interesting information about order dates, and the number of null values, but I also notice a data quality issue.  My record count is different from my distinct record count indicating I have duplicate records in my data.  Let’s do some data cleansing to address this issue.

Data Cleansing

Using natural language, I can request that Infoworks AI does some cleansing of my data.  Since I know I have a duplicate data issue, I’ll start there.

Deduplication

In order to deduplicate my data, I’m going to first generate a query to retrieve my distinct records by entering ‘select distinct records by every column from my orders table’ in the chat window on the right half of the screen.  

Once I’m happy with the query, I can create a view from the data that will be the deduplicated data set I’ll use for the rest of my analysis.  To create a view, I simply type ‘create a view from the above query’ in the chat window on the right and run the results.

Formatting

I also need customer data for my analysis.  In looking at my customer data, I need to do some cleansing.  I need my first name and last name fields combined into a ‘last name, first name’ format.  I also need the dates displayed in ‘MM/dd/yyyy’ format.  Lastly, I need the postal code formatted as a 5 character string with leading zeros.

We can fix this in a single request using natural language from Infoworks AI.  I’m simply going to enter the following into the chat.

‘from the customers table return the customer id, customer name formatted as ‘last_name, first_name’, birthdate formatted in MM/dd/yyyy format, and postal code formatted as a 5 character string with leading zeros’

The returned SQL correctly formats and cleanses the data.

Summary

In this blog post we used Infoworks AI to begin exploring and organizing our data.  We looked at the table metadata to verify we had the columns we needed.  We profiled the data and identified a duplicate row issue and we used Infoworks AI to deduplicate the data.  Finally, we saw how Infoworks AI enables us to cleanse and format the data.

In Part 4: Data Analysis and Reporting.  We’ll see how Infoworks AI enables data analysts to apply the RFM model to our data set and generate reporting and visualizations for their presentation to the CFO.  

Customer Segmentation Use Case Part 2: Getting Started with Infoworks AI

Introduction

In Part 2 of our series on creating a Customer Segmentation use case with Infoworks AI, we will detail how to connect to your data warehouse, upload additional supporting data, create a knowledge base so Infoworks AI can better understand your data, and create a project.    

In part 1, we described the Customer Segmentation use case, introduced the RFM segmentation framework, and articulated how we can use that segmentation method to provide value for our fictional company, Nexacore.  Click here to review that blog post.

Connect To Your Snowflake Data Warehouse

With Infoworks AI, it’s simple to connect to your data.  In the steps below, we’ll walk through how to connect to your Snowflake data warehouse.  For our use case we’ll be connecting to the Nexacore marketing data warehouse.  

  1. From the home screen navigate to ‘Data Warehouse Connections’ on the left hand navigation and click ‘Add Connection’.
  1. Provide the credentials to your data warehouse.  Be sure to check the note regarding allowing inbound traffic from Infoworks AI.
  1. Test the connection and Fetch Schema to retrieve the technical metadata from the cloud data warehouse.
  2. Optionally profile the data to get additional profiling information such as sample values.
  1. Simply close the connection after fetching the schema.  Your information will be saved.

Upload Supporting Data

In addition to the data in my data warehouse, I also have some supporting data that I need to include for my analysis.  My customer data is by state, but I need to do aggregate analysis by region.  Since my data warehouse does not yet have the regional information, I need to upload the data.

In Infoworks AI, I can upload data sets to my data warehouse by accessing the ‘Import Data’ icon on the left side of the screen.  From there I can simply drag a file into the designated area to import it.

Once the file is uploaded, I configure the table and warehouse information and select ‘Import Data’.

Now the data will be available in my data warehouse with the other tables.

Once we’re connected to data, it’s time to incorporate the business rules and definitions.  That’s where a knowledge base comes in.

Create a Knowledge Base

Now that we’ve connected to the Nexacore data, the next step is to create a knowledge base.  The knowledge base is a set of business rules and definitions that augment the technical metadata of the data warehouse so that a data analyst can use the natural language of the business to make requests of the data.  This is an optional step, but can add a significant amount of value by enabling Infoworks AI to be aware of your business and understand your data.

  1. To create a knowledge base, navigate to ‘Business Glossary’ on the left hand navigation and select ‘Add Business Glossary’ on the right side of the screen.
  1. Choose the data warehouse connection you just created.
  1. On this screen you will also see the option to upload one or more .csv files.  To see a sample business glossary and understand the format, click the sample glossary link on the page.  When you’re ready, upload your files, by selecting the ‘Choose A File’ button.
  1. Once your business glossary file(s) are uploaded, click ‘Save Changes’ and close the page.

Create a Project

Once you have connected your data and created a knowledge base, you can create your project and build your data set.  A project will organize all of your chat sessions, data warehouse connection, and knowledge base in one place.  A project is what you will access to start or continue a chat session.

  1. To create a project navigate to ‘Projects’ on the left hand navigation and select ‘Create New Project’ on the right side of the screen.
  1. On the next screen name your project and optionally add a description.  Then choose your data warehouse connection, and you’re done!

You’ve successfully created a project using Infoworks AI.  In the next blog post we’ll start exploring and cleansing your data using Infoworks AI.

Summary

In this blog post we walked through how to get started with Infoworks AI.  We connected to Nexacore’s data, we uploaded supporting data, we added business context to the data, and we created a project.

In the upcoming blog posts in this series, we’ll continue to explore using Infoworks AI to address Nexacore’s customer segmentation use case.

In Part 3: Data Exploration and Cleansing with Infoworks AI, we’ll see how Infoworks AI automates and accelerates data exploration through profiling data.  We’ll also see how Infoworks can be used for data cleansing.  All without having to write code.

In Part 4: Data Analysis and Reporting.  We’ll see how Infoworks AI enables data analysts to apply the RFM model to our data set and generate reporting and visualizations. 

Customer Segmentation Use Case Part 1:  Introduction

Introduction

Marketing departments utilize customer segmentation to categorize individuals into distinct groups based on specific criteria, aiming to more effectively target them in campaigns. Often, these criteria must be extracted or derived from various elements within the customer data. This data is frequently ‘dirty,’ containing missing or erroneous values, and can also evolve over time, necessitating continuous application of segmentation strategies.In this blog post series, we will showcase how Infoworks AI can accelerate a customer segmentation project. We will demonstrate how to use Infoworks AI to gather, cleanse, and analyze the relevant data, effectively segmenting the customer data set and operationalizing the segmentation process for ongoing analysis.

Use Case

Nexacore is a fictional electronics retailer that has experienced an increase in customer churn.  Nexacore’s CEO has launched a company-wide initiative to address this urgent threat to their growth.  The marketing team needs to understand customer buying behavior to design targeted marketing campaigns to reduce churn and increase sales.  The marketing data analytics team must move quickly to complete the analytics for a presentation to their CMO. 

The team has recommended a customer segmentation model called RFM, which stands for Recency, Frequency, and Monetary.  This model scores customers based on how recently a customer made a purchase, how frequently they purchase, and how much money they have spent with the organization.  Based on these three measures, customers are divided into quartiles and a composite score is generated.

The marketing data analytics team needs to access all of the company’s customer data, cleanse that data, apply the RFM scoring, and generate a report showing the results.

Value

With this segmentation, Nexacore can develop targeted marketing campaigns for each customer segment.  For example, customers who purchased recently and frequently, but are lower in spending (RFM scores of 113 and 114), could be categorized as loyal, low spending customers.  Further categories can include:

CategoryRFM ScoresCampaign Strategy
Nexacore Loyal111, 112, 113, 114Weekly promotions
Churned Loyal Customers411, 412, 421, 422Loyal customer 25% discount
High Spending New Customers141,142Weekly promotions + 10% off on your next visit coupon
Seasonal Shoppers131, 132, 231, 232, 331, 332, 431, 432Seasonal catalog and 25% off coupon

Summary

Segmenting customers enables marketing departments to target specific groups with tailored campaign content. Nexacore is leveraging customer segmentation to address an increase in churn. The marketing data analytics team is working to explore, cleanse, and apply RFM scoring to the data for effective segmentation. This approach will allow Nexacore to market to each customer segment in a way that resonates more effectively.

In the upcoming blog posts in this series, we’ll explore how they leveraged Infoworks AI to expedite the completion of this customer segmentation use case.

In Part 2:  Getting Started with Infoworks AI, we’ll get connected to our data set, integrate business rules and definitions, and create a project.

In Part 3:  Data Exploration and Cleansing with Infoworks AI, we’ll see how Infoworks AI automates and accelerates data exploration through profiling data.  We’ll also see how Infoworks can be used for data cleansing.  All without having to write code.

Lastly, in Part 4:  Data Analysis and Reporting.  We’ll see how Infoworks AI enables data analysts to apply the RFM model to our data set and generate reporting and visualizations.